Introduction
When dealing with large sets of data with many parameters conventional visualization methods such as diagrams, curves, 2d/3d scatter charts, histograms etc. are often unable to present the data in a meaningful way.
XDAT is a tool that allows you to display column-based data sets with many parameters in just one single chart and helps you to extract the most relevant information on cause/effect relationships with just a few clicks. The core feature that is used for this purpose is the parallel coordinate chart, which is explained below.
Usecase Example
Let's assume the following situation: You have done a few hundred compression tests with specimens of different geometry, material stiffness and density.
To make things more complicated, these tests were done at different temperatures, with different loading velocities. All of these parameters just randomly distributed. The deformation and load at failure was measured, and now you want to find out under what conditions high failure loads were reached with low deformation.
See how XDAT could help you with this analysis:
What XDAT does
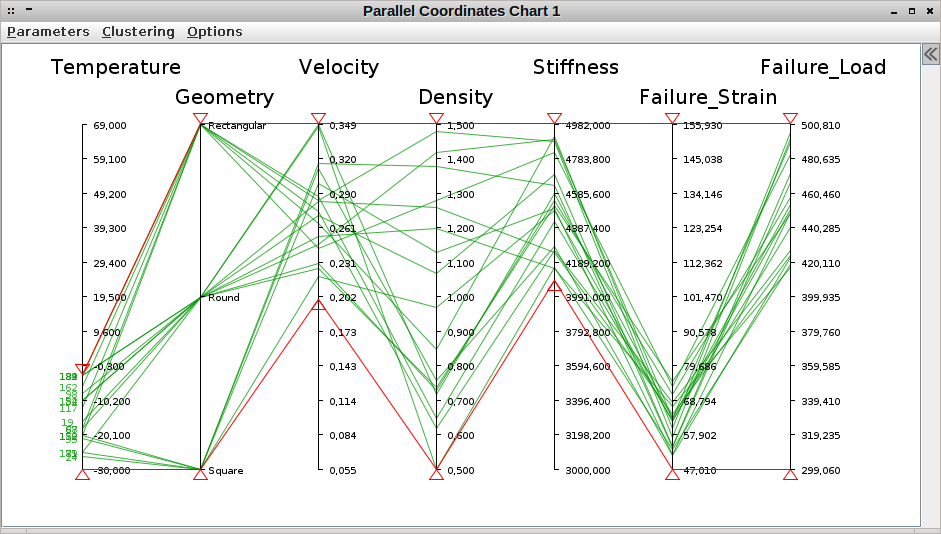
The picture below shows how XDAT displays the data. Each of the parameters is represented by one vertical axis. (Black lines). The parameter title is shown on top of each axis.
Each test (also called design) is represented by a green line that crosses the axes at the ordinates corresponding to the values observed for their respective parameter in that test.
This display method is called parallel coordinate visualization and was invented by Alfred Inselberg.
As you can see, this 7-dimensional dataset can easily be displayed in just one chart.
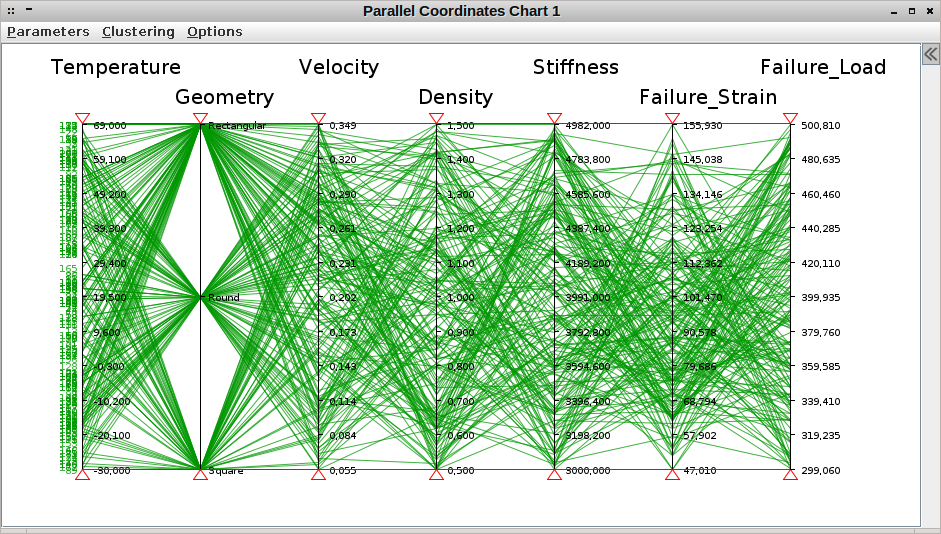
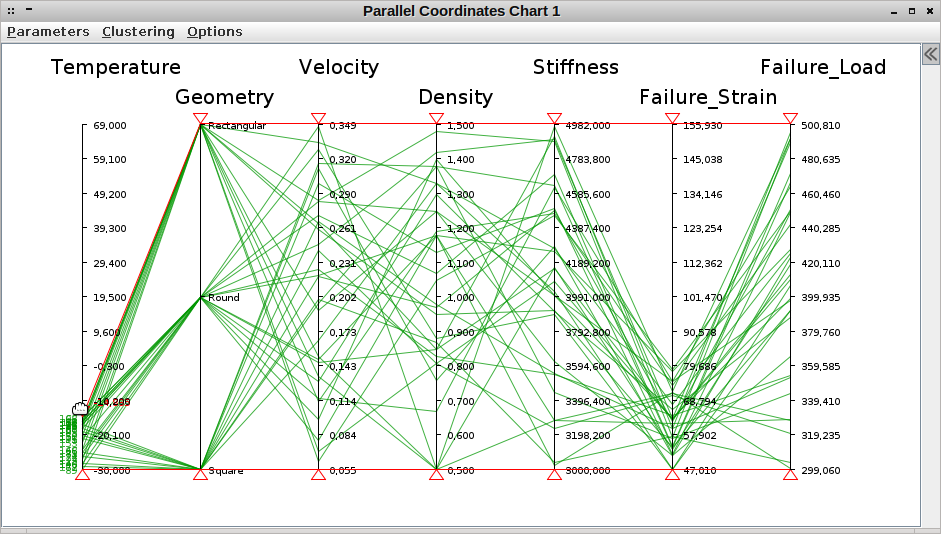
In order to analyse the data further, so-called filters can be used. These are the small red triangles on the top and bottom of each axis that are connected by red lines.
These can be dragged with the mouse and only designs that cross the axis between its filters are displayed. In the example below all designs with large failure strains have been filtered. You can see that only tests carried out at low temperatures remain. Also the loading velocity seems to play a role.
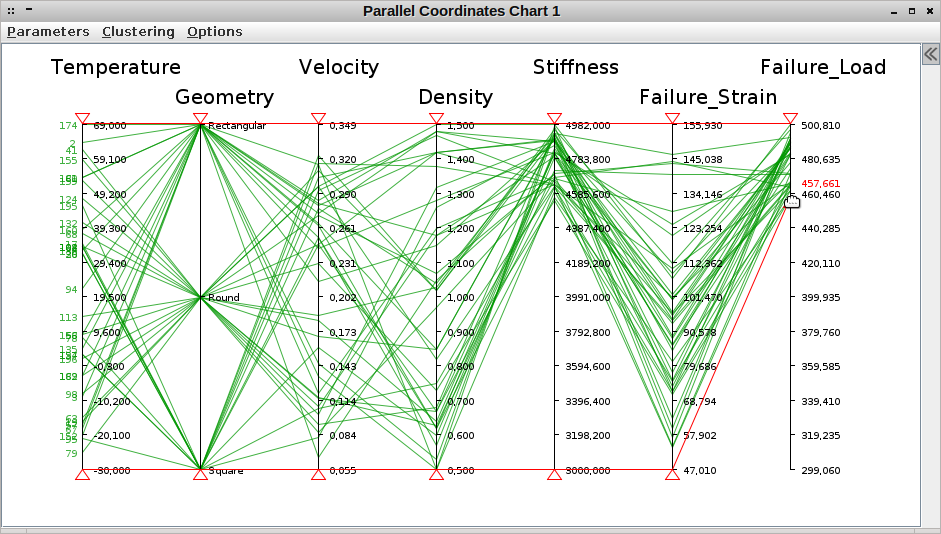
Now the filter on failure strain has been set back to its initial state and all designs with low failure loads are filtered out instead.
Apparently the material stiffness is the driving parameter for the failure load.
So we conclude that if we want to get high failure loads with low failure strains, we need to use specimens with large stiffness and test with high velocity at low temperature. Let's verify this assumption by removing all filters and applying new ones on these input parameters.
As you can see, the conclusion seems to be valid. Although no filters are applied on failure strain and load, we can see only designs that show low failure strain and high failure load.
Using 2D Scatter Charts
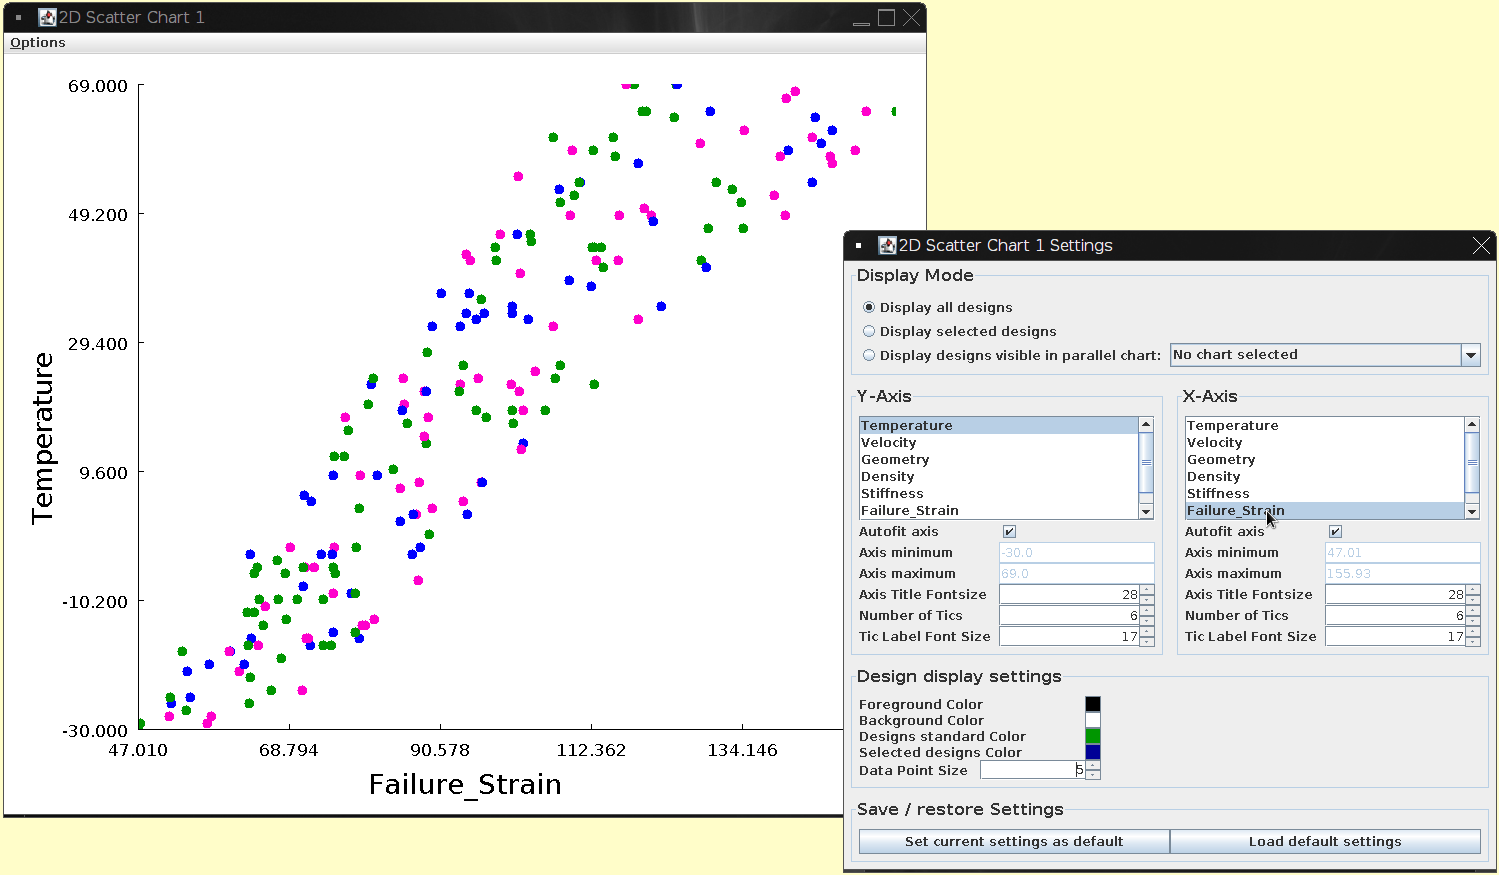
Another useful feature that XDAT has is the flexible way of plotting data in 2D scatter plots. This plot's settings dialog allows to change the plotted axis on the fly by just one click. This comes in handy when you want to run through many parameter combinations quickly to look for patterns.
Open a 2D scatter plot and select the "Settings" item in its "Options" menu. A dialog will come up that gives you a list of all parameters in the dataset for both x and y axis. Select another parameter for one axis and the plot will immediately be updated. You can even run through the parameter list using the cursor up and down keys on your keyboard. This way you can go through dozens of different parameter combinations in just a couple of seconds, without the need for many painful clicks for each of them.
Feature Summary
Features of XDAT include:
- Imports ascii based data in column format (one parameter per column)
- Supports tab, space, any whitespace, comma, semi-colon and user-specified delimiting character between columns, with the option to treat consecutive delimiters as one
- Supports floating point values and string values
- Supports different (US and German) locales for parsing number formats
- Supports automatic parameter naming based on header line in imported text file
- Data can be plotted in parallel coordinate charts or 2D scatter charts.
- Can open multiple charts on one dataset
- Displayed parameters can be chosen on open charts
- Sessions can be saved to file
- Various display settings (colors, font sizes, axis range etc...) can be made on a per-chart level or on a user preferences level.
- Axes on parallel coordinate charts can be moved around through click-and-drag
- Possibility to cluster the data and change display colors for each cluster, or switch cluster display on/off
- Data can be reloaded or modified without closing charts
- Basic data editing functionality (change values, remove designs, remove parameters and change parameter orders)
There are more features available, see the user manual for a complete overview.
Real World Example
For a real world example of how XDAT can be used you can take a look at the nature article "Balancing national economic policy outcomes for sustainable development".
Thanks to Mohammed Basheer for sharing this link with me and for several feature suggestions and detailed bug reports.